


 15 / 32

13
I N N O V AT I O N S • V O L . V I I , N O. 2 • 2 0 1 5
is the easy part; gathering the volumes of requisite
pipeline data, well … that could take decades.
Digging Up Details
In order for predictive software to deliver on
its promise, it requires a lot of data: pipeline
diameters, age, pressure, temperatures, geology,
proximity to roadways, ground depth, previous
incidents, etc. – multiplied by the kilometers of
pipe in the ground. The more data these systems
receive and analyze, the better they can project
pipeline failures and proactively recommend
remediation, repairs, replacements, and
relocations.
For utilities, capturing this data is not as easy
as one might think. “Today, when you need to
operate on a pipe, you may not know exactly
where it’s located or what it’s made of,” says
Philippe Simon, a gas utility and distribution
expert with T.D. Williamson (TDW). “Often,
operators can’t formally acquire this information
until a line is excavated for maintenance or
relocation.”
This isn’t to say that some pipe data doesn’t
exist. In fact, about 20 years ago, utilities started
more consistently compiling data, but most of
that information was logged on paper and filed
away in metal cabinets. In other words, it doesn’t
exist in a neatly structured, easy to access data
warehouse with a smooth graphic user interface
and smart query function.
Step By Step
Utilities continue to embrace modeling software,
which evolves on an almost monthly basis. And
with each day there is an opportunity to capture
and store even more data about their lines.
Gaz de France, which owns several hundred
thousand kilometers of distribution pipelines across
the globe, is leading the industry in its commitment
to data capture and input. “With so many
kilometers of existing pipe, to say nothing of the
thousands of kilometers being laid every year, it’s safe
to say that Gaz de France’s data input is perpetual,”
explains Simon. “And Gaz de France, and its
customers, will reap the benefits of such a significant
investment.”
From here, the industry expects to see a new
level of pipeline technology that does more than
analyze input and project potential failures: it’s
looking forward to solutions that also allow utilities
to monitor their pipe systems in real time. This
kind of technology could work hand in hand with
existing solutions, meaning utility companies
would continue to rely on predictive software to
help prevent leaks, and they would leverage new
technology to alert them, in real time, to leaks as
they occur.
Tremendous Opportunities
Although integrated, real-time leak detection
will be a reality one day, gas utilities must meet
customer expectations today: increased safety and
reliability. And they will continue to depend on
trusted leak detection technologies from companies
like GAZOMAT™, a subsidiary of TDW, whose
offerings help utilities detect and characterize leaks,
and determine the appropriate level of response.
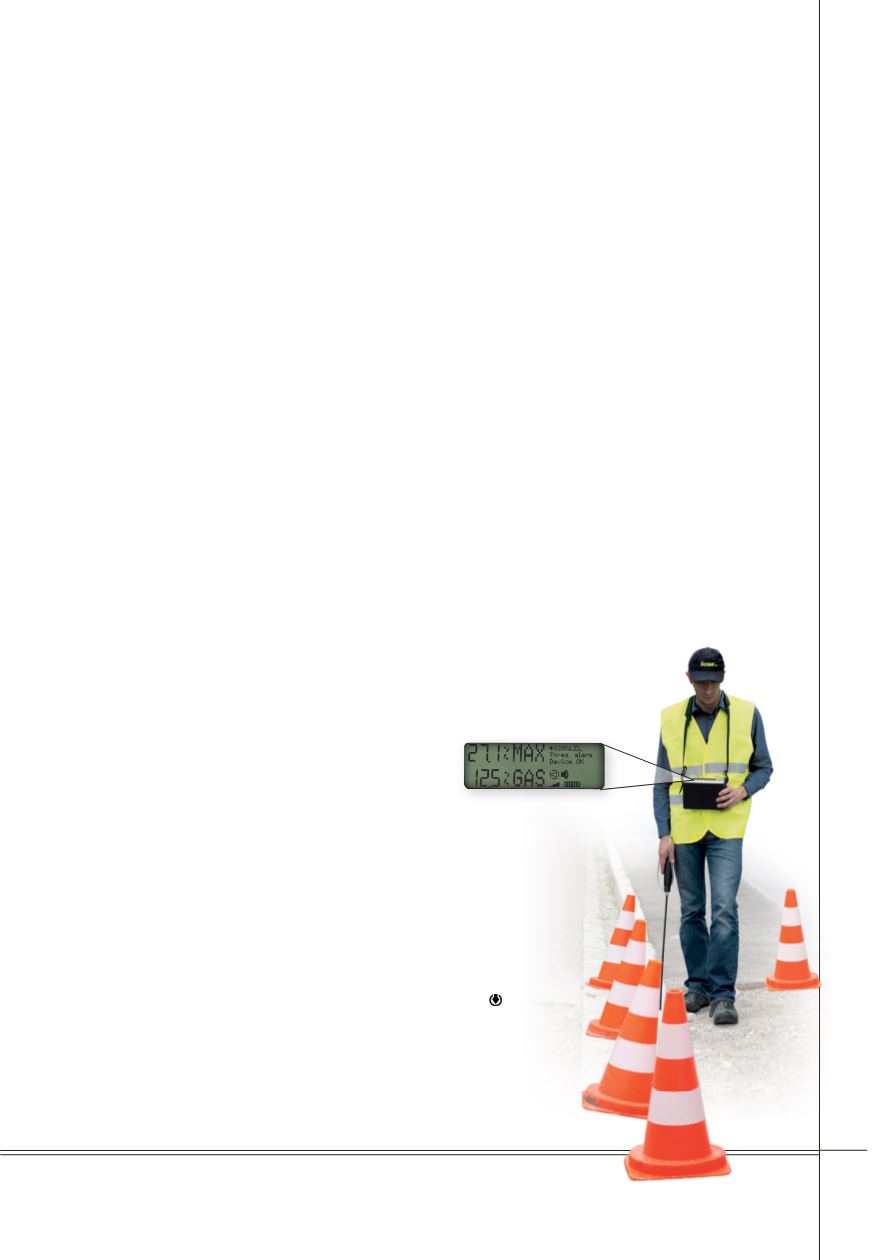
“Through recent advances in leak detection
technology, like the portable Catex™ 3-IR Analyzer,
operators can gather and correlate a wealth of leak
information,” says Simon. “They can also more
accurately assess the risk of a leak or accident.
And since the software prioritizes
attention and investment based on
risk severity, the utility’s efficiency
is significantly increased.”
It’s a powerful affirmation
of the industry’s commitment
to progress, that – even
after more than 100 years
– leak projection and
detection technologies
are still improving,
and faster than ever
before.