


 21 / 32

I N N O V AT I O N S • V O L . V I I , N O. 2 • 2 0 1 5
19
an economic incentive for removing the liquids
from Eagle Ford production and selling them at
a premium. And innovation (read: Automation)
can be used to get more liquids out easier and
faster. Which is particularly important in light
of two projections: The Energy Policy Research
Foundation’s forecast that by 2017, 19 percent of
all NGLs produced in the United States will come
from the Eagle Ford, and Citigroup’s prediction
that exports of light and ultralight crude from the
United States could reach 1 million barrels a day
by the end of 2015.
Mexico, for one, would like to get its hands on
some of that – a tenth of the total, to be exact.
Following the BIS decision to allow the export
of ultralight oil, Petroleos Mexicanos (PEMEX)
petitioned the U.S. Commerce Department to
import 100,000 barrels
of light crude per day. If
approved, it would allow
Mexico to increase gasoline
production and improve
refining. In exchange,
PEMEX would send its heavy oil to refineries on
the United States Gulf Coast that are configured
for processing it.
Automation is Part
of the Profit Equation
In a low price environment, pushing more product
is a sensible option. But it’s not the only one.
Reducing costs and eliminating inefficiencies are
equally valid choices.
The removal of wet gas liquids fulfills all of
those goals. In addition to providing marketable
products, it aids in pipeline maintenance. Liquids
in the line reduce the optimum flow of natural
gas and drastically increase fuel and power
consumption. Capturing them avoids those issues.
“One of the major line items in the operation
C O V E R S T O R Y
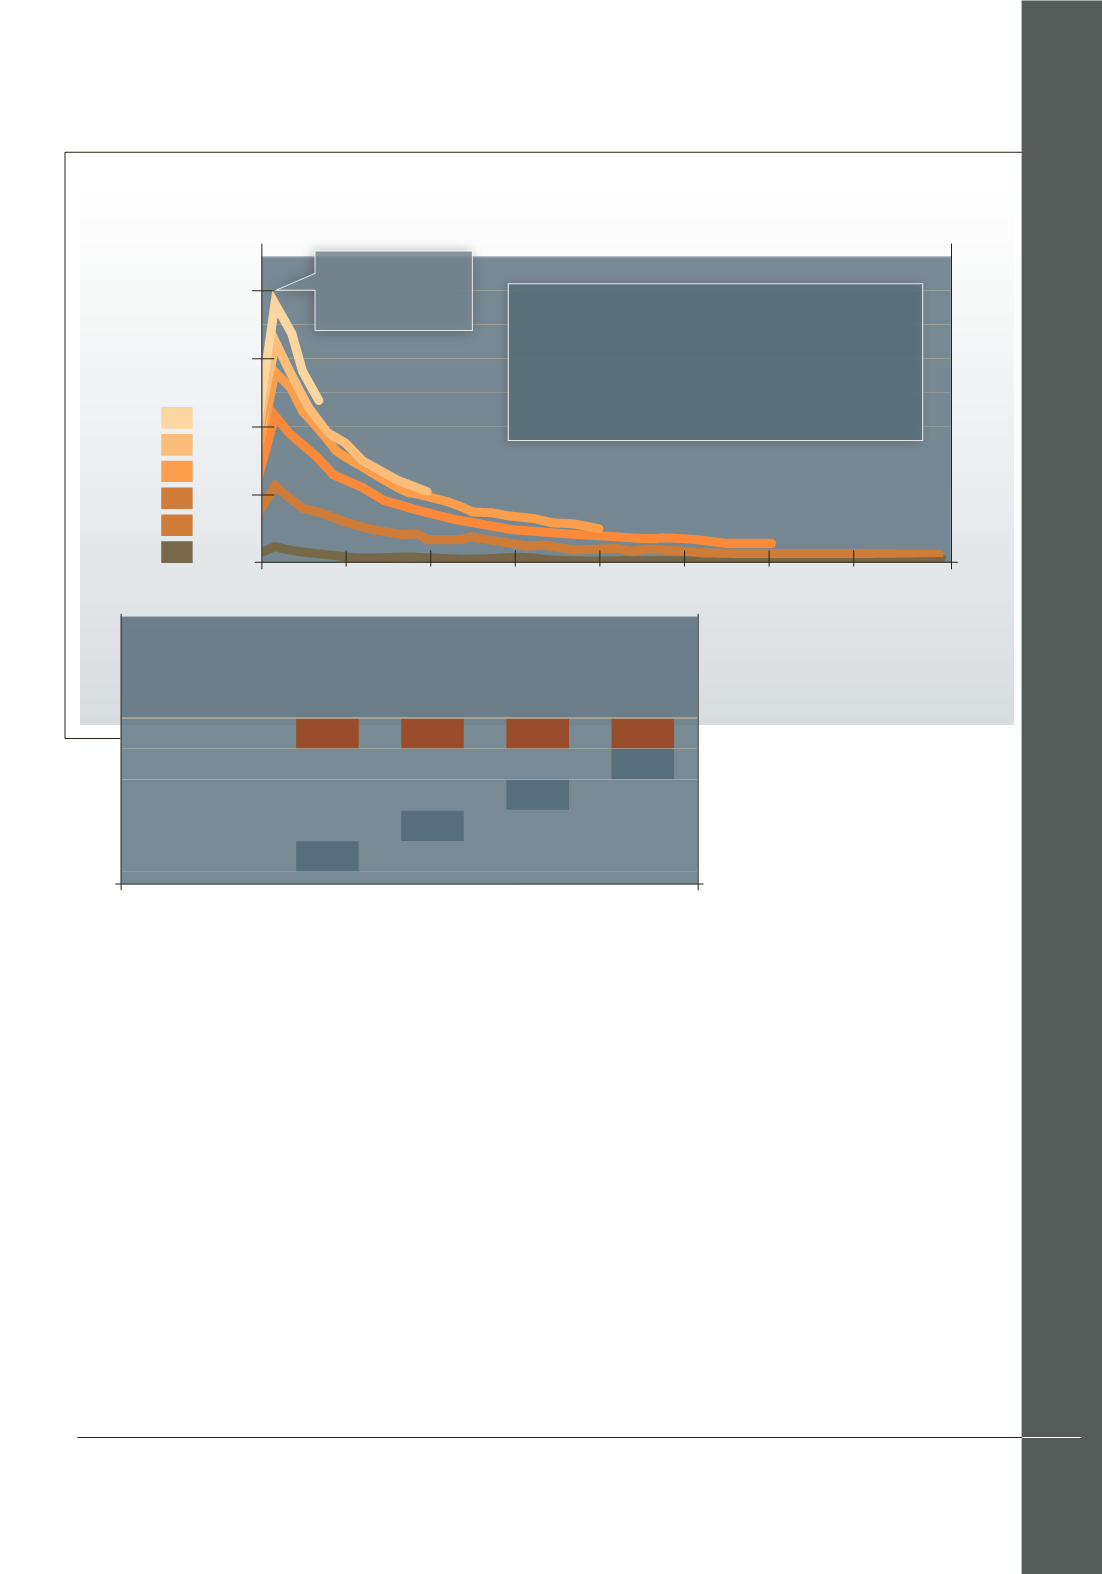
400
2014
2013
2012
2011
2010
2009
300
200
100
6
12
18
24
30
36
42
2009
2010
2011
2012
2013
-70%
-68%
-68%
-64%
-69%
-30%
-39%
-47%
-48%
-20%
-28%
-27%
-20%
-42%
Average Oil Production Per Well
During the First 48 Months of Operation
Year-Over-Year Decline in Production in Wells Drilled
in the Eagle Ford Region from 2009-2013
MONTHS OF OPERATION
BBL/D
First Full Month
of Production
YEAR 1
YEAR 2
YEAR 3
YEAR 4
Increased Initial Production from
~ 25 bbl/d in 2009
to
~ 375 bbl/d in 2014
Source: Energy InformationAdministration
CONTINUED ON PAGE 27